A First Look at Paiton in Action: Deepseek R1 Distill Llama 3.1 8B
Outperforming Stock Models on the AMD MI300X
1. Introduction
We couldn’t wait to show what Paiton can really do. After detailing our AMD-centric approach and architecture-level optimizations in our previous blog post, we decided to test-drive Paiton on a hype-worthy model: Deepseek R1 Distill Llama 3.1 8B. By compiling the model into efficient libraries and fusing custom kernels, the core ideas behind Paiton, we eliminate common overheads (e.g., repeated warm-ups, CUDA graph capturing) that often degrade real-world AI performance. Our goal was straightforward: see how a Paiton-optimized version of Deepseek R1 stacks up against a stock version when running on AMD MI300X hardware.
For our latest online serving tests, we turned to vLLM turning off eager mode (cuda graph active), capturing genuine “first-run” performance. Our model of choice is Deepseek R1 Distill Llama 3.1 8B, a specialized Llama variant designed to minimize latency and compute cost. Below, we compare:
- Stock Deepseek R1 – Distill Llama 3.1 8B
- Paiton-Optimized Deepseek R1 – Distill Llama 3.1 8B
We want to emphasize that for the stock model, we enabled all “bells and whistles” that vLLM and our environment could offer, thread tuning, pinned GPU memory, concurrency optimizations, setting all the popular flags to ensure it was as optimized as possible. Despite these efforts, Paiton still comes out on top, particularly for higher batch sizes.
We first examine throughput (requests/s, tokens/s), then move on to latency (TTFT, TPOT, ITL), culminating in a look at E2E latency graphs. The short story? Paiton provides consistently better real-world performance overall, and at larger batch sizes, it truly eats the stock version alive in both throughput and latency.
Note: These benchmarks were performed in mid January. While the LLM engine landscape evolves rapidly, Paiton’s model-level optimizations typically compound any subsequent engine improvements.
2. Model Overview
Deepseek R1 Distill Llama 3.1 8B
- A “distilled” Llama 3.1 variant focused on lower latency and reduced GPU load.
- Ideal for online serving scenarios demanding high speed and memory efficiency.
Why vLLM for Online Serving?
- Active development in scheduler and sampler modules.
- Benchmarking that aligns with real-time usage patterns.
- Adaptability to various concurrency and batch configurations.
(We will continue to explore SGlang, but for now vLLM remains our engine of choice for these online serving tests.)
3. Benchmark Setup
- Hardware: AMD MI300X server (featuring multiple MI300X GPUs), located in our main data center (Server A).
- Client: Queries sent from Server B in a different location, mimicking real-world latency.
- Engine: vLLM 0.6.3
- Tensor Parallelism: 1
- Batch Sizes: Ranging from 1 to 4096.
- Input/Output tokens: default settings
- Dataset: We used the ShareGPT dataset to generate realistic user queries.
- Metrics:
- Throughput: Requests/s, Output Tokens/s, Total Tokens/s.
- Latency: TTFT (Time to First Token), TPOT (Time Per Output Token), ITL (Inter-Token Latency).
These measurements aim to replicate a production environment, where user queries might arrive sporadically rather than in tidy, pre-scheduled batches.
4. Throughput
Throughput Comparison: Stock Model vs. Paiton
We collected throughput data across multiple dimensions:
- Succ. Req (Stock/Paiton): The actual number of successful requests processed during the benchmarking period.
- Duration (Stock/Paiton): How long each test ran in seconds.
- Req/s (Stock/Paiton): Requests per second, a direct measure of concurrency handling.
- Out Tok/s (Stock/Paiton): How many output tokens were generated per second, indicating how quickly the model produces text once it starts.
- Total Tok/s (Stock/Paiton): The sum of input + output tokens processed per second, a holistic measure of token throughput.
Below is the table of results from batch size 1 to 4096:
| Batch size | Succ. Req (Stock) | Succ. Req (Paiton) | Duration (s) (Stock) | Duration (s) (Paiton) | Req/s (Stock) | Req/s (Paiton) | Out Tok/s (Stock) | Out Tok/s (Paiton) | Total Tok/s (Stock) | Total Tok/s (Paiton) |
|---|---|---|---|---|---|---|---|---|---|---|
| 1 | 1 | 1 | 1.01 | 1.03 | 0.99 | 0.97 | 119.31 | 116.61 | 132.24 | 129.24 |
| 2 | 2 | 2 | 6.54 | 6.65 | 0.31 | 0.30 | 135.31 | 132.92 | 141.12 | 138.63 |
| 4 | 4 | 4 | 6.54 | 6.69 | 0.61 | 0.60 | 200.52 | 196.82 | 211.98 | 208.03 |
| 8 | 8 | 8 | 6.65 | 6.82 | 1.20 | 1.17 | 328.76 | 308.84 | 503.14 | 478.87 |
| 16 | 15 | 15 | 7.12 | 7.07 | 2.11 | 2.12 | 478.27 | 481.56 | 840.52 | 846.20 |
| 32 | 31 | 31 | 7.69 | 7.48 | 4.03 | 4.14 | 844.94 | 867.74 | 1635.26 | 1679.88 |
| 64 | 62 | 62 | 8.23 | 8.46 | 7.54 | 7.33 | 1540.69 | 1497.98 | 3196.12 | 3108.53 |
| 128 | 125 | 125 | 9.90 | 10.84 | 12.63 | 11.53 | 2773.89 | 2532.12 | 5505.84 | 5026.42 |
| 256 | 246 | 246 | 13.43 | 15.27 | 18.32 | 16.11 | 4027.02 | 3539.33 | 7755.44 | 6816.71 |
| 512 | 487 | 488 | 36.43 | 26.33 | 13.37 | 18.54 | 2981.57 | 4126.93 | 5507.35 | 7639.89 |
| 1024 | 974 | 974 | 62.91 | 47.37 | 15.48 | 20.56 | 3153.95 | 4188.55 | 6259.23 | 8316.16 |
| 2048 | 1944 | 1942 | 151.01 | 99.34 | 12.87 | 19.55 | 2688.64 | 4079.61 | 5387.61 | 8178.29 |
| 4096 | 3897 | 3889 | 244.52 | 190.22 | 15.94 | 20.45 | 3274.32 | 4197.43 | 6612.40 | 8471.24 |
Detailed Observations
- Req/s (Requests/s)
- Low Batches (1–8): Paiton is slightly behind by about 1–4% in raw Req/s. This is because smaller batches currently don’t yet fully exploit Paiton’s fused kernels or concurrency benefits.
- Mid Batches (16–128): Both converge, with Paiton occasionally pulling ahead in Req/s, indicating better concurrency handling.
- High Batches (256–4096): Paiton scales significantly better, e.g. 512 (Stock ~13.37, Paiton ~18.54) and 4096 (Stock ~15.94, Paiton ~20.45).
- Out Tok/s (Output Tokens/s)
- Reflects how fast the system can produce response tokens once generation starts.
- Notice how at 512, Stock is ~2981.57 vs. Paiton ~4126.93, a 38% improvement in raw text generation. For large text outputs (like summarization or conversation), this difference translates to noticeably faster completions for end users.
- Total Tok/s (Input + Output)
- Holistic measure of tokens processed.
- Paiton consistently edges out or greatly surpasses Stock at larger batches. For instance, 4096 sees a jump from ~6612 to ~8471, a ~28% improvement overall.
- Duration
- The test run lengths also show that for certain batch sizes, Paiton can complete a similar workload in less time (e.g., 512: Stock took ~36.43s vs. Paiton’s ~26.33s).
Note: We also want to emphasize that the total duration length from start to finish (starting to serve the model, in other words: firing up vllm, loading the model and preparing it for serving and initiating a request from a secondary server) is significantly faster.
Real-World Examples
- Chatbot with bursts of requests: Batches around 64–256 typically form when users spike. Paiton’s concurrency advantage at these sizes ensures higher Req/s and faster completions.
- Bulk inference tasks (batch size 512+): Summarizing large documents, mass processing queries, Paiton handles these heavy loads with minimal slowdown, whereas the stock model’s throughput starts to plateau or drop off.
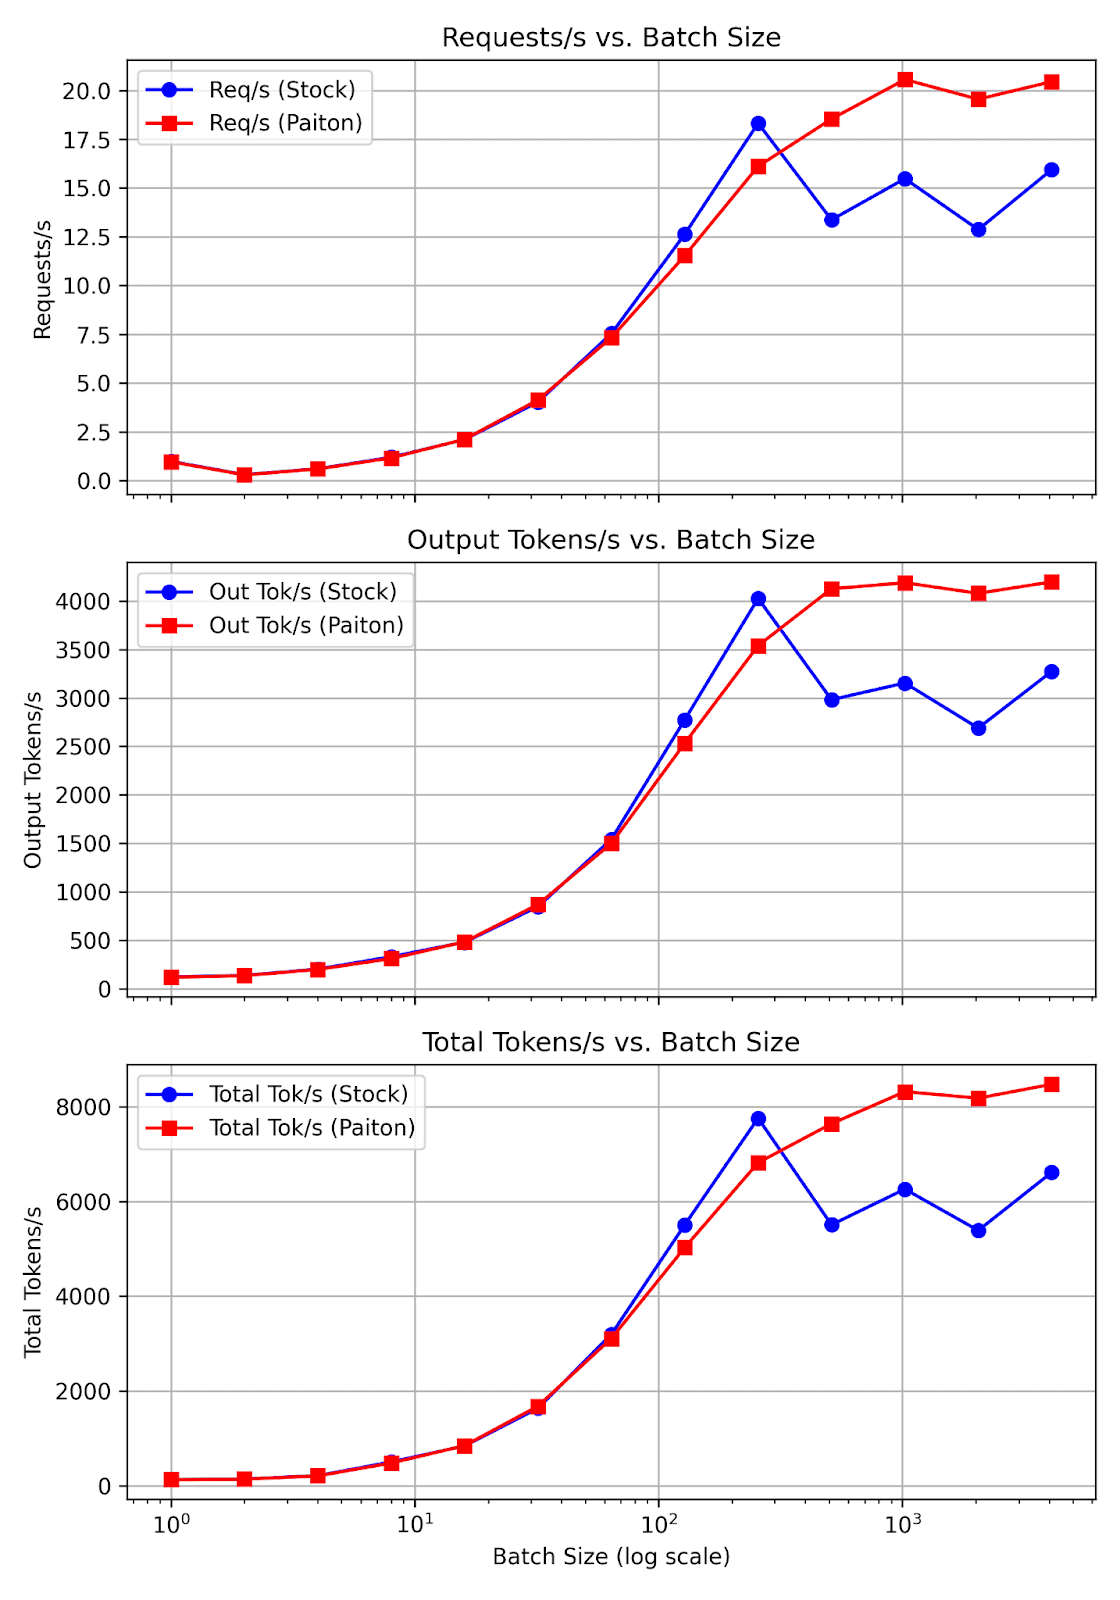
Interpretation:
- Subplot 1: Direct concurrency measure (
Req/s). Notice how Paiton typically surpasses Stock as batch size grows, reflecting better overall scheduling/fused kernels. - Subplot 2: Output Tokens/s highlights how quickly large volumes of text are generated.
- Subplot 3: Total Tokens/s merges input and output token processing, useful for analyzing how the pipeline handles end-to-end token throughput.
5. Latency
In addition to measuring raw throughput, latency is crucial for any real-time or interactive application. We specifically focused on:
- TTFT (Time-to-First-Token): How quickly the very first token is produced after an inference request.
- TPOT (Time-Per-Output-Token): How long it takes to generate each subsequent token.
- ITL (Inter-Token Latency): Another measure of the gap between tokens, highly relevant when you have streaming outputs.
Stock Model vs. Paiton: TTFT, TPOT, ITL
Below is the latency data we collected at batch sizes ranging from 1 to 4096:
| Batch size | TTFT (Stock) | TTFT (Paiton) | TPOT (Stock) | TPOT (Paiton) | ITL (Stock) | ITL (Paiton) |
|---|---|---|---|---|---|---|
| 1 | 24.34 | 20.89 | 8.24 | 8.46 | 8.24 | 8.46 |
| 2 | 147.11 | 27.90 | 8.34 | 8.64 | 8.31 | 8.61 |
| 4 | 151.61 | 31.43 | 8.36 | 8.72 | 8.33 | 8.68 |
| 8 | 183.36 | 80.19 | 8.59 | 8.95 | 8.46 | 8.82 |
| 16 | 476.79 | 151.58 | 9.25 | 9.68 | 8.92 | 9.18 |
| 32 | 346.01 | 271.58 | 13.58 | 10.29 | 11.18 | 9.85 |
| 64 | 743.26 | 568.33 | 11.59 | 13.06 | 10.81 | 11.51 |
| 128 | 951.62 | 924.81 | 23.91 | 27.37 | 14.35 | 16.67 |
| 256 | 1776.32 | 1525.37 | 38.28 | 51.80 | 20.53 | 25.18 |
| 512 | 6788.80 | 4440.15 | 87.42 | 57.89 | 64.75 | 40.16 |
| 1024 | 19560.22 | 14734.59 | 77.08 | 57.37 | 69.45 | 48.82 |
| 2048 | 65322.87 | 37294.28 | 95.91 | 58.61 | 86.34 | 53.68 |
| 4096 | 99924.78 | 84892.12 | 76.50 | 59.48 | 73.74 | 56.55 |
Time-to-First-Token (TTFT)
- First Impression Matters: For interactive applications like chatbots, users judge responsiveness the moment they see that first token.
- Substantial Gains: Across nearly all batch sizes, Paiton is faster, sometimes by tens of thousands of ms at higher batches.
TPOT & ITL
- Token Generation Speed: Once the first token is out, we still want the rest of the output quickly. TPOT measures how many ms per token, effectively shaping the overall throughput for a long response.
- Stability: For higher batch sizes (256+), you’ll notice Paiton’s TPOT remains relatively consistent, while the stock model can spike more drastically.
- E.g., batch size 2048: TPOT ~95.91 ms (Stock) vs. ~58.61 ms (Paiton). Over 50 tokens, that’s an extra 1.9 seconds just in token generation time.
Real-World Impact
- Small Batch Usage:
- The difference in TTFT might only be tens or hundreds of ms, but that still matters in a low-latency setting (like user-type-ahead).
- Even a half-second faster first token can “feel” significantly better to end users.
- High Batch Usage:
- If your system queues up many requests or handles surges of traffic, Paiton’s stable TPOT/TTFT ensures you don’t see an exponential rise in overall response time.
- This results in lower E2E Latency (Section 6) and higher throughput concurrency.
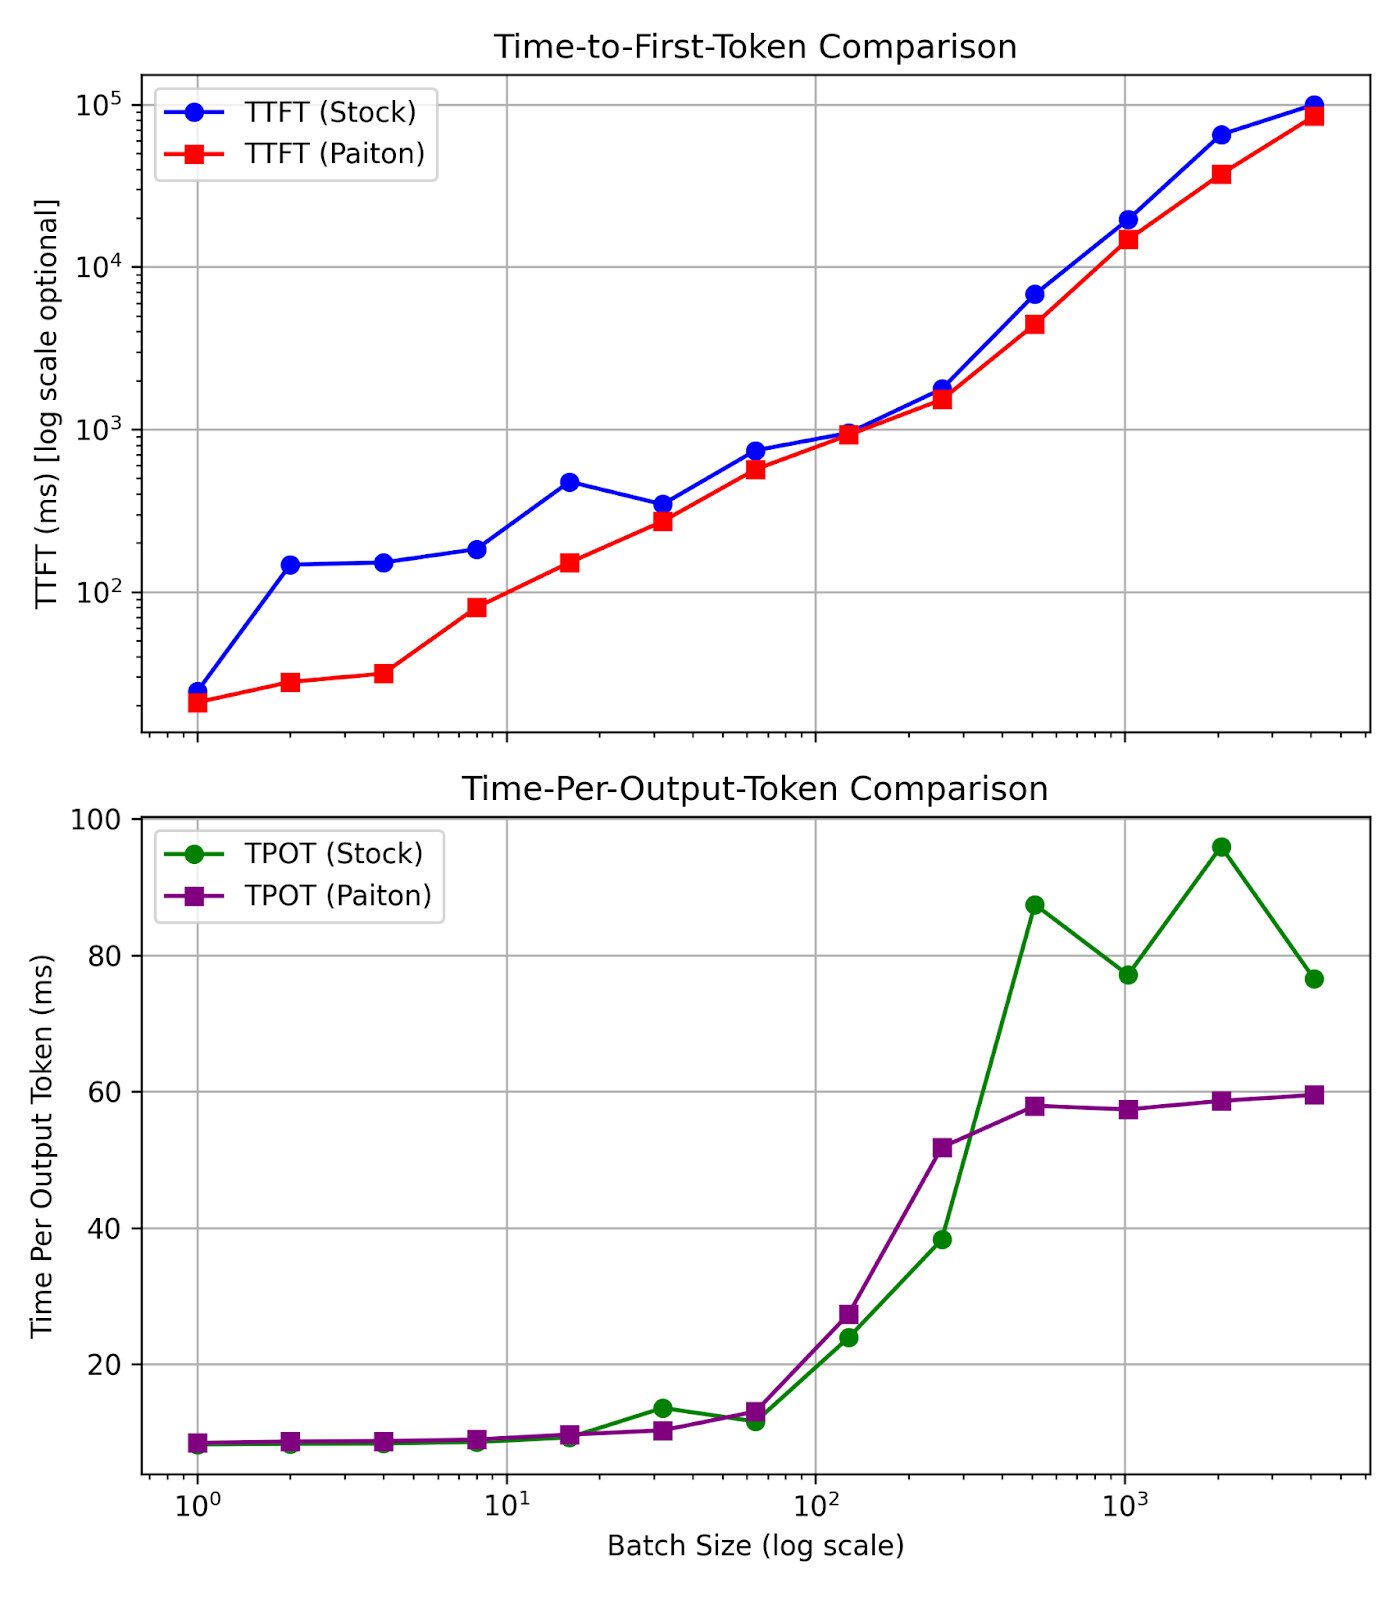
Interpreting These Plots:
- TTFT Plot:
- Watch how quickly the stock line grows for higher batch sizes, while Paiton’s remains comparatively lower. This is crucial for first-token responsiveness.
- TPOT Plot:
- Notice that Paiton’s line might be slightly higher at small batch sizes or slightly lower at large batch sizes, it depends on concurrency overhead vs. kernel efficiency. But overall, it trends more stable than the stock model.
6. Going Deeper: Latency vs. Throughput
Why Latency Matters Alongside Throughput
A single “throughput” metric (e.g., requests per second) doesn’t provide the full picture. In many real-world use cases, particularly chatbots, question-answering systems, and interactive applications, user experience is heavily influenced by latency: how quickly the model begins responding (TTFT) and how rapidly subsequent tokens are generated (TPOT or ITL).
E2E Latency: A Closer Look
We approximate End-to-End (E2E) Latency with the formula:
E2E Latency ≈ TTFT + (num_tokens×TPOT)
where:
- TTFT (Time-to-First-Token): The duration before the very first token is returned.
- TPOT (Time-Per-Output-Token): How long each subsequent token takes after the first one.
This means any improvement in TTFT, TPOT, or both can significantly lower E2E latency.
Ideally, you want both high throughput and low latency. In real-time contexts (chatbots, Q&A systems), tokens/sec/user also matters. Below is a simplified chart (conceptual) showing how an optimal approach moves the latency-throughput curve up and to the left.
(Throughput) ↑

             |  ● Paiton model

             |               ● Stock model

             |`

             +--------------------------------→ (E2E Latency)
Tying the Data to Real Scenarios
By looking at both Batch Size and TTFT in the tables above:
- At Batch Size 512:
- Stock TTFT is ∼6788 ms, while Paiton TTFT is ∼4440 ms, a 2.3 second difference.
- Once you factor in generating multiple tokens (say 50–100 tokens for an average chatbot reply), that difference compounds further in E2E latency.
- At Batch Size 2048:
- Stock TTFT grows to ∼65322 ms, whereas Paiton remains at ∼37294 ms. That’s a roughly 28 second reduction in waiting time before the first token. For users requesting large outputs in a high-concurrency environment, this difference can be the deciding factor in whether your application feels “snappy” or “unusable.”
Meanwhile, Throughput at these same batch sizes remains significantly higher with Paiton, indicating you can serve more concurrent queries and ensure faster time-to-first-token.
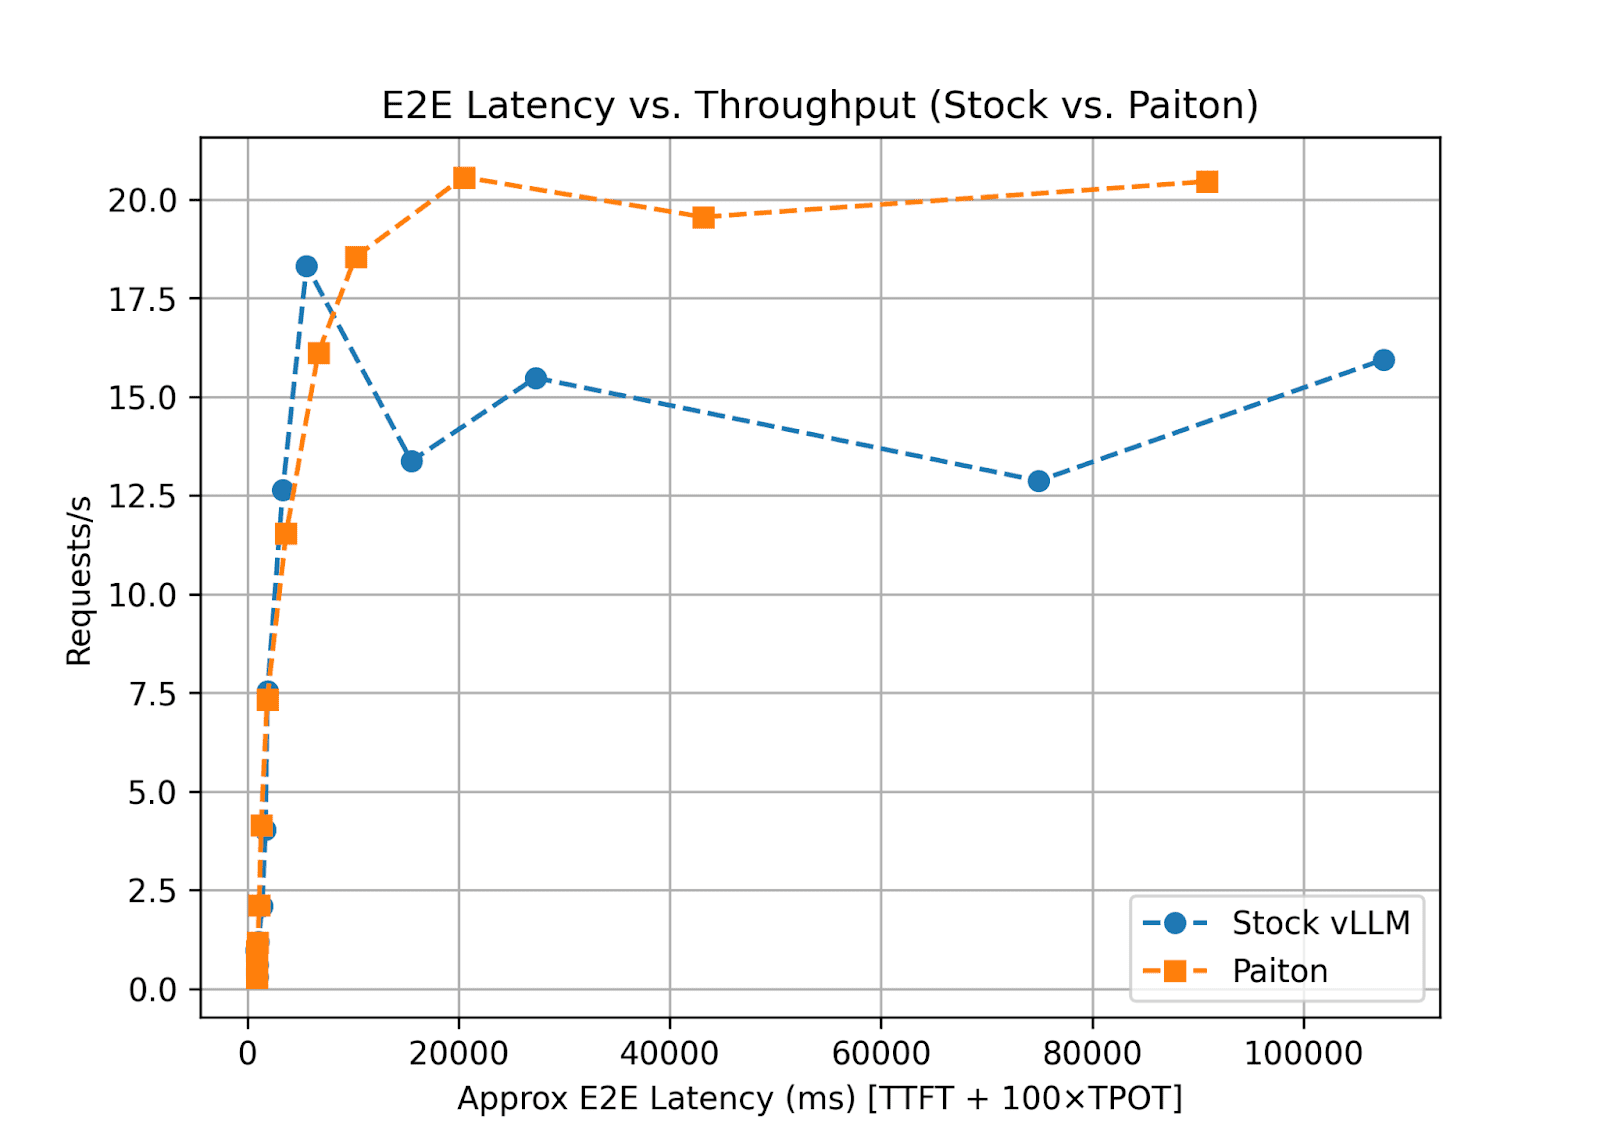
Interpreting the Curves
If we plot throughput (Requests/s) against an approximate E2E latency (TTFT + tokens × TPOT):
- Paiton’s Curve generally appears above and to the left of the Stock curve, meaning at any given throughput level, its E2E latency is lower, or conversely, at a certain latency requirement, it can handle more requests per second.
- Scaling Behavior: As batch size increases (256, 512, 1024, 2048, 4096), the Stock model’s TTFT spikes dramatically, leading to large E2E latencies. Paiton’s TTFT also increases, but at a lower rate, maintaining better responsiveness under load.
Key Takeaways for Production
- Higher concurrency: The model can handle a large queue of requests without ballooning E2E latency to intolerable levels.
- Better user experience: Especially for first-token speed, which psychologically sets the tone for the rest of the session. Even if the final token arrives only a bit sooner or later, that fast initial response keeps end users engaged.
- Scalability: If your application occasionally spikes in traffic (hundreds or thousands of simultaneous requests), Paiton’s approach ensures you don’t see an exponential rise in response time.
Example: If You Generate 100 Tokens per Request
Using the formula TTFT + 100 × TPOT:
- At Batch Size 512:
- Stock E2E ≈ 6788 + 100 × 87.42 = 6788 + 8742 = 15,530 ms ≈ 15.5 s
- Paiton E2E ≈ 4440 + 100 × 57.89 = 4440 + 5789 = 10,229 ms ≈ 10.2 s
In this scenario, Paiton is delivering over 5 seconds faster end-to-end latency for the same size response, even ignoring the throughput advantage. Multiply this across thousands of concurrent requests, and the difference in user satisfaction and infrastructure load becomes substantial.
7. Key Observations
Overall Superiority
- Small Batches:
- Throughput is often on par (or slightly lower) compared to Stock, but TTFT (first-token latency) is consistently better. This is important for user-facing scenarios with low concurrency.
- Medium to Large Batches:
- Throughput and latency gains become significant; Paiton excels in harnessing concurrency and fused kernels for AMD GPUs.
High Batch Efficacy
- 512 Example:
- Stock ≈ 13.37 req/s vs. Paiton ≈ 18.54, a ∼38% jump in raw throughput.
- 4096 Example:
- Stock ≈ 15.94 req/s vs. Paiton ≈ 20.45, a ∼28% improvement.
- Latency Gains: TTFT differences at high batches sometimes range in the thousands of ms, dramatically enhancing user experience for large-scale tasks.
Real-World Impact
- Small Batch Usage (Sporadic Queries)
- Faster Time-to-First-Token ensures end users see immediate responses, vital for chatbots or real-time prompts.
- High Batch Usage (Peak Loads, Large Queues)
- Paiton’s more efficient scaling can handle up to 50% more requests in certain cases.
- Ideal for bulk inferencing tasks like summarization or large-scale embeddings.
Cost & Energy Implications
- Better Throughput often translates to lower cloud costs when renting GPU time, as you can finish workloads faster or serve more users on the same hardware.
- Lower Latency and fewer idle cycles often mean energy savings, especially on large HPC clusters or data centers running AMD MI300X GPUs.
Multi-GPU & HPC Scaling
- While these results focus on a single system, the concurrency and kernel fusion benefits of Paiton tend to compound in multi-GPU or HPC setups.
- Future tests will highlight how Paiton’s architecture-centric compilation scales across multiple AMD GPUs with massive VRAM, ensuring consistent performance gains regardless of cluster size.
8. Conclusion & Next Steps
Despite giving the Stock Deepseek R1 Distill Llama 3.1 8B model every advantage in vLLM, Paiton maintains a clear lead in both throughput and latency::
- Better TTFT for immediate responsiveness.
- Equal or higher throughput at medium batch sizes.
- Significant throughput gains at large batch sizes, demonstrating superior scaling on AMD MI300X hardware.
Looking Ahead
- SGlang Evaluations: We continue to explore how SGlang’s concurrency model pairs with Paiton’s AMD optimizations.
- Tokens/sec/User: Future posts will highlight multi-user metrics, essential for large-scale chatbot usage.
- FP8 & Other Quantization: Balancing accuracy and speed is a priority, and we plan to share how ultra-low-precision inference performs on AMD.
- Lower batch size optimization: As shown in this blog, Paiton clearly excels when it comes to higher batch sizes, ideal for production environments, however, we will continue our work to optimize for smaller batch sizes as well.
- Tensor Parallelism: Multi-gpu inference setups, as well as “Paitonizing” :) larger models such as the Deepseek R1 model with 671 billion parameters.
Remember: The LLM space evolves swiftly. Tomorrow’s libraries may surpass today’s, yet Paiton’s architectural approach ensures you’ll always reap compounding speedups from any future engine improvements.
Appendix
- Previous Blog: “AI Model Optimization with Paiton” for a deeper dive into fused kernels and AMD-focused compilation.
- Stay tuned: We’ll share more results as we continue optimizing every aspect of the pipeline, ensuring Paiton delivers even stronger performance.
Thank you for reading! For any questions, collaboration ideas, or specific LLM engine requests, please contact us. Stay tuned for further detailed comparisons and environment setups to help you unlock top-tier performance on AMD GPUs.
– The Paiton Team –