Introducing Our Benchmarking Tool: Powered by dstack
1. Introduction
Benchmarking is an essential part of optimizing AI models and software applications. Whether you’re testing AI model inference speeds, profiling different hardware configurations, or ensuring system performance over time, having a reliable benchmarking tool is crucial. However, many existing tools suffer from issues like inconsistent environments, difficult configuration setups, and lack of automation.
vLLM’s benchmarking capabilities are excellent, but we recognize that many users build custom wrappers to streamline their benchmarking workflows. Instead of just automating existing processes, we set out to create something more comprehensive with additional features to enhance benchmarking efficiency.
To address these challenges, we built a new benchmarking tool that integrates seamlessly with dstack, allowing for automated, reproducible, and scalable benchmarking workflows.
2. What is dstack?
dstack is an open-source platform designed to manage ML and AI workflows efficiently. It simplifies infrastructure management, automates execution, and ensures reproducibility; three key aspects that make it perfect for benchmarking orchestration.
Key Features of dstack that We Utilize:
- Reproducible Environments: Containerized execution ensures consistency across different runs.
- Job Orchestration and Management: Define benchmarking tasks, automate execution, and manage results seamlessly.
- Multi-Cloud and Multi-Hardware Support: Easily benchmark across GPUs, whether locally or in the cloud.
3. Why We Built This Benchmarking Tool
Common Challenges in Benchmarking:
- Difficult Environment Configuration: Minor system differences can impact results, leading to inconsistent benchmarks.
- Manual Execution and Lack of Automation: Re-running benchmarks manually is time-consuming and error-prone.
- Inability to Track Performance Over Time: Without versioning, it’s hard to detect regressions or improvements effectively.
- Conflict Prevention: When multiple developers use shared GPUs, resource conflicts can arise.
How Our Tool Solves These Challenges:
- Automated Benchmarking Runs: No manual setup required; everything is orchestrated with dstack.
- Reproducible and Isolated Execution: Each run happens in a controlled environment, ensuring consistency.
- Version-Controlled Results: Logs and reports are stored for easy comparison across different runs.
4. Key Features of Our Benchmarking Tool
1. Simple Web Interface
Running benchmarks should be straightforward. Our tool provides a minimal web interface that allows users to start benchmarking with just a few clicks.
2. Reproducible and Isolated Environments
Our tool leverages dstack to spin up containerized environments. This eliminates issues caused by dependency mismatches and system variations.
3. vLLM-Based Benchmarking
Our tool exclusively benchmarks using vLLM (currently), due to its popularity, available benchmark scripts and massive community.
4. Automated Parameter Sweeping
Our tool provides the flexibility to test various batch sizes, learning rates, and GPU configurations effortlessly. Users can reuse completed benchmarks, eliminating the need to repeatedly input the same parameters, streamlining the benchmarking process.
5. Scalable Execution
Our tool adapts to your hardware (thanks to dstack), whether you’re running benchmarks on a local machine, cloud instance, or multi-GPU cluster.
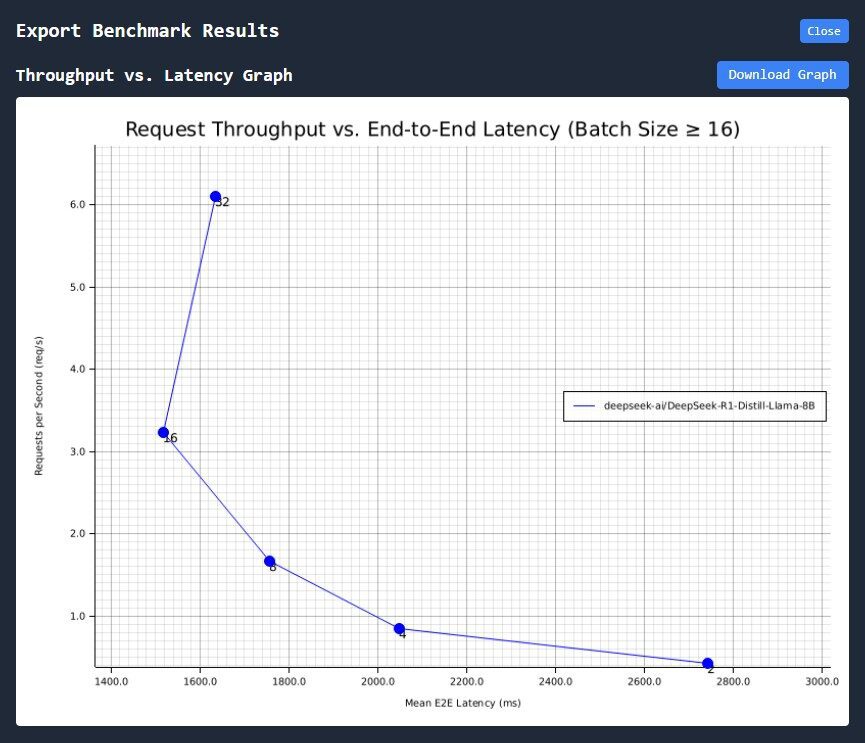
6. Auto-Generated Performance Reports
After execution, performance data is logged and can be exported:
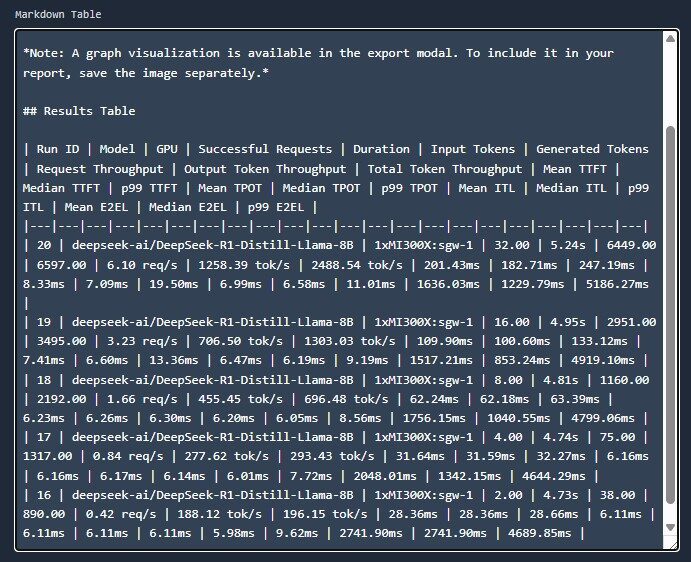
On top of that, it also auto generates a markdown table:
5. How It Works
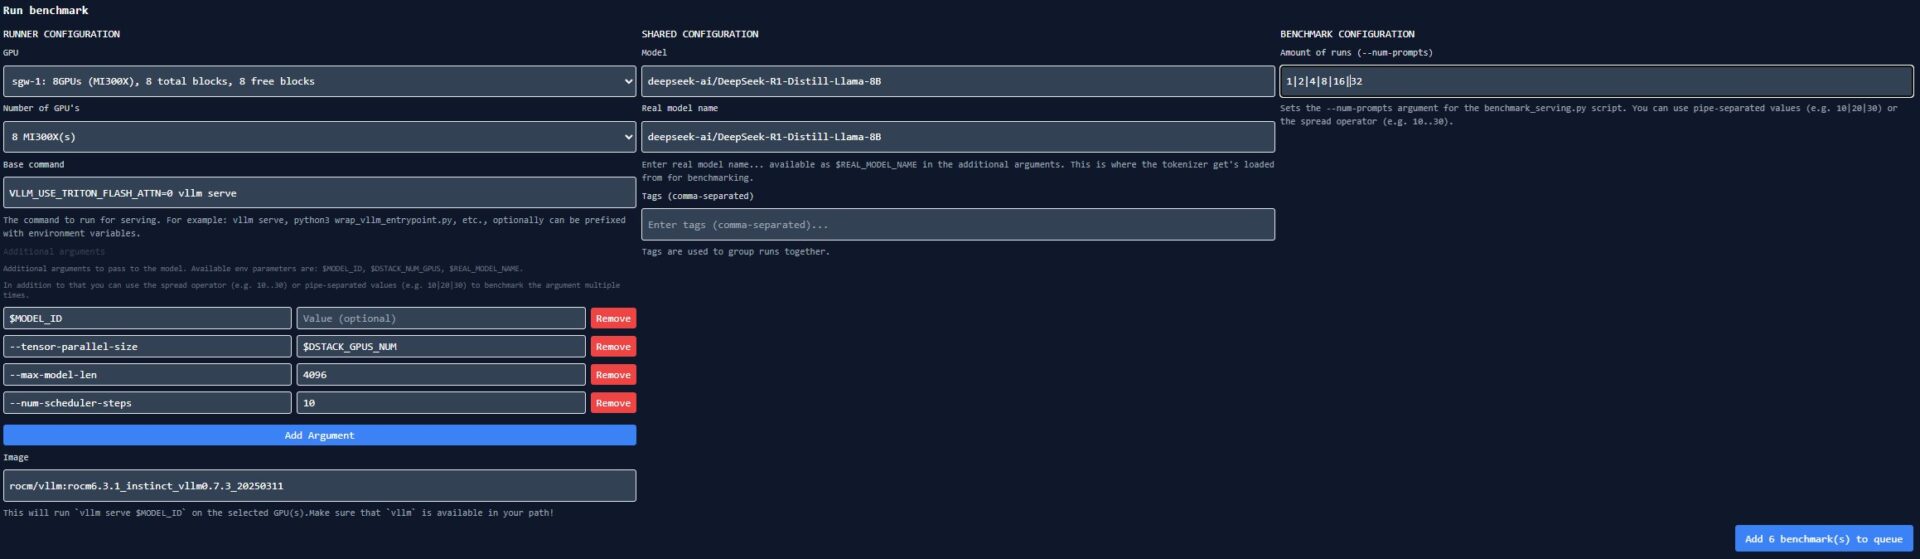
Step 1: Configure Your Benchmark
By default the tool fills in the fields for a standard benchmark on top of vllm. You can adjust the parameters, models, arguments as you need using the interface.
There are a few environment variables that can be used in the arguments, as well as the option to use .. and | to multi-schedule.
Step 2: Run the Benchmark
Once the setup is filled in, you schedule the benchmark. The button will show, based on the configuration, how many benchmarks will run.
For example, if you fill in num prompts with: 10|20|30 it will schedule 3 benchmarks.
If on top of that you want to test various –num-scheduler-steps 10|20|30 then it will result in 9 benchmarks, one for each of the possible combinations.
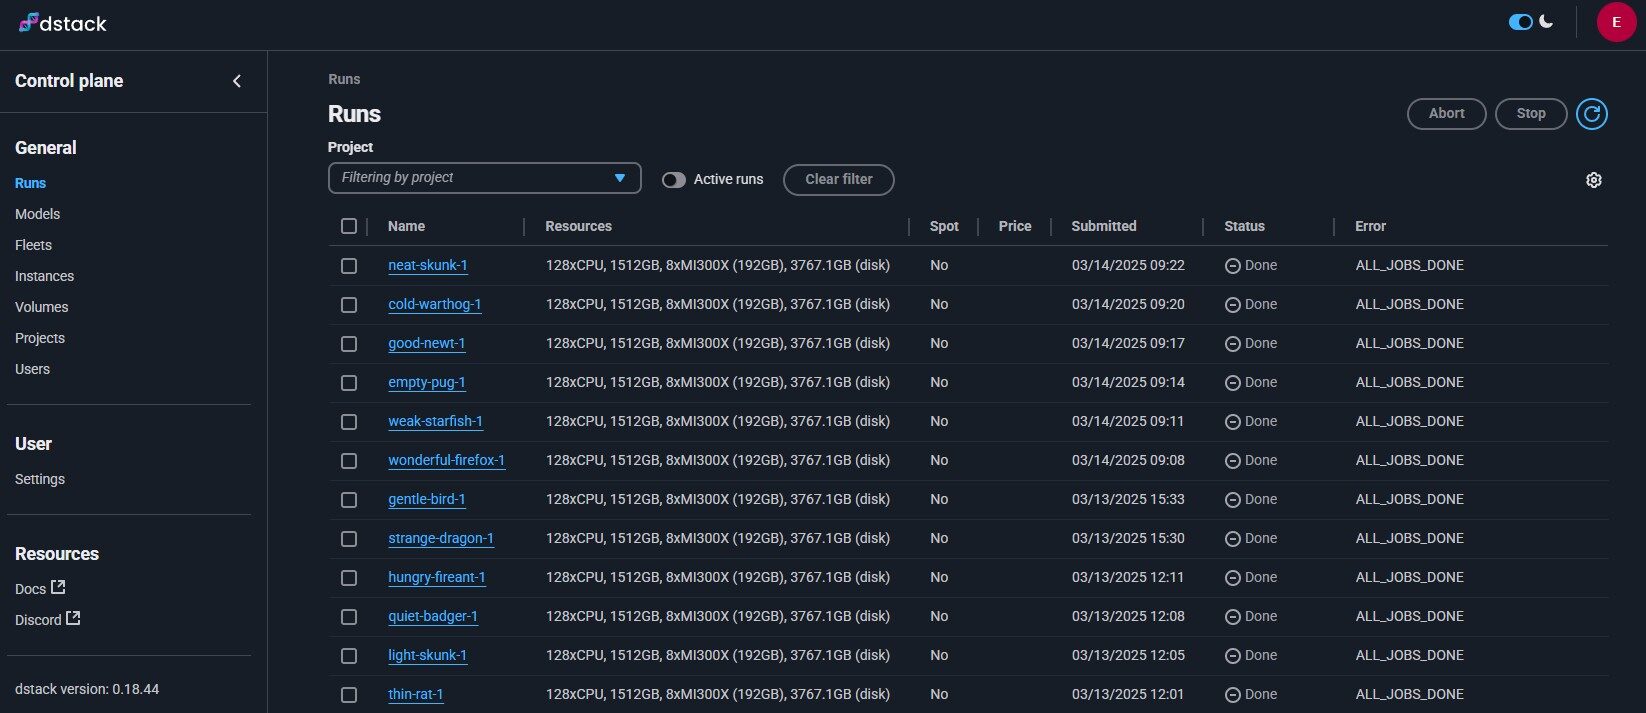
Step 3: View Results
When all benchmarks are complete you can click on the row to see graphs regarding gpu usage and energy consumption. Selecting a row will also compare various parameters against other runs.
To export, tick the box before every benchmark and press export, a new window will open with a graph and results table ready to be pasted in a markdown document!
Benchmark tool walk-through video by Rob H..
6. Comparing our benchmark tool
| Feature | Existing Tools | Our Benchmarking Tool |
| Automated Execution | Manual setup | Fully automated |
| Reproducibility | Environment-dependent | Containerized environments |
| Cloud Support | Limited | Works locally & in cloud |
| CI/CD Integration | Manual testing | Seamless integration |
| vLLM-Based Benchmarking | Not always supported | Fully integrated with vLLM |
7. Real-World Use Cases
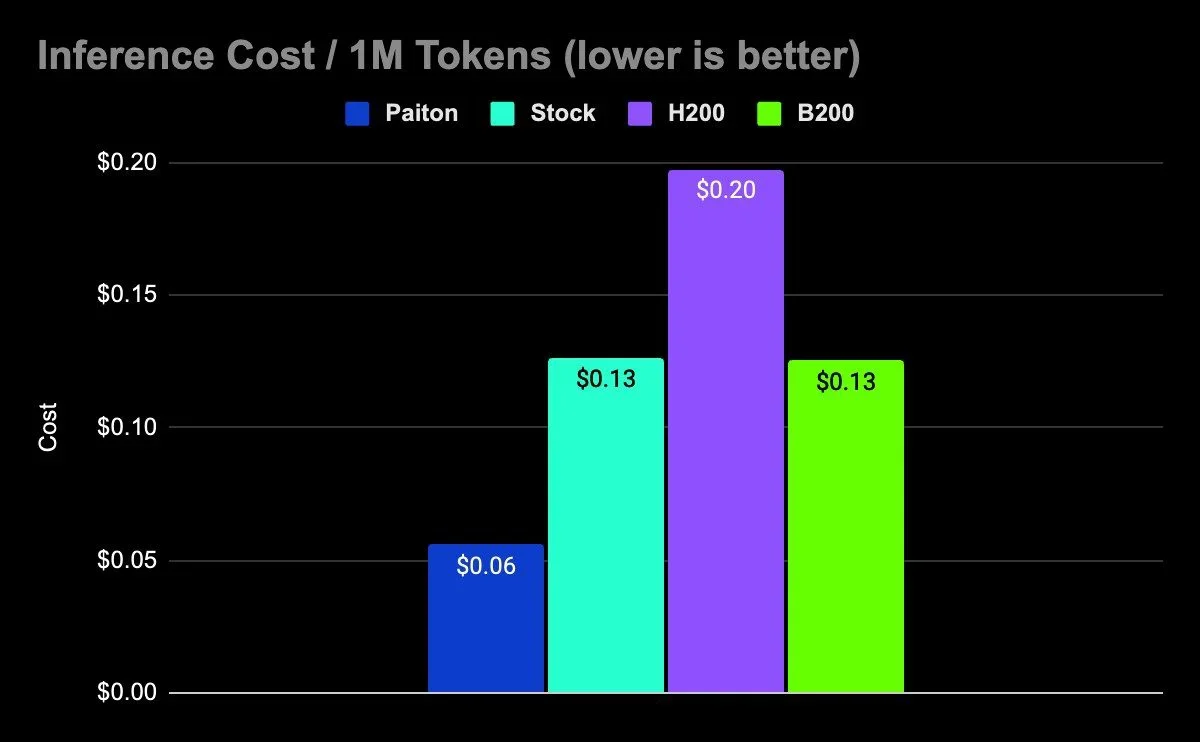
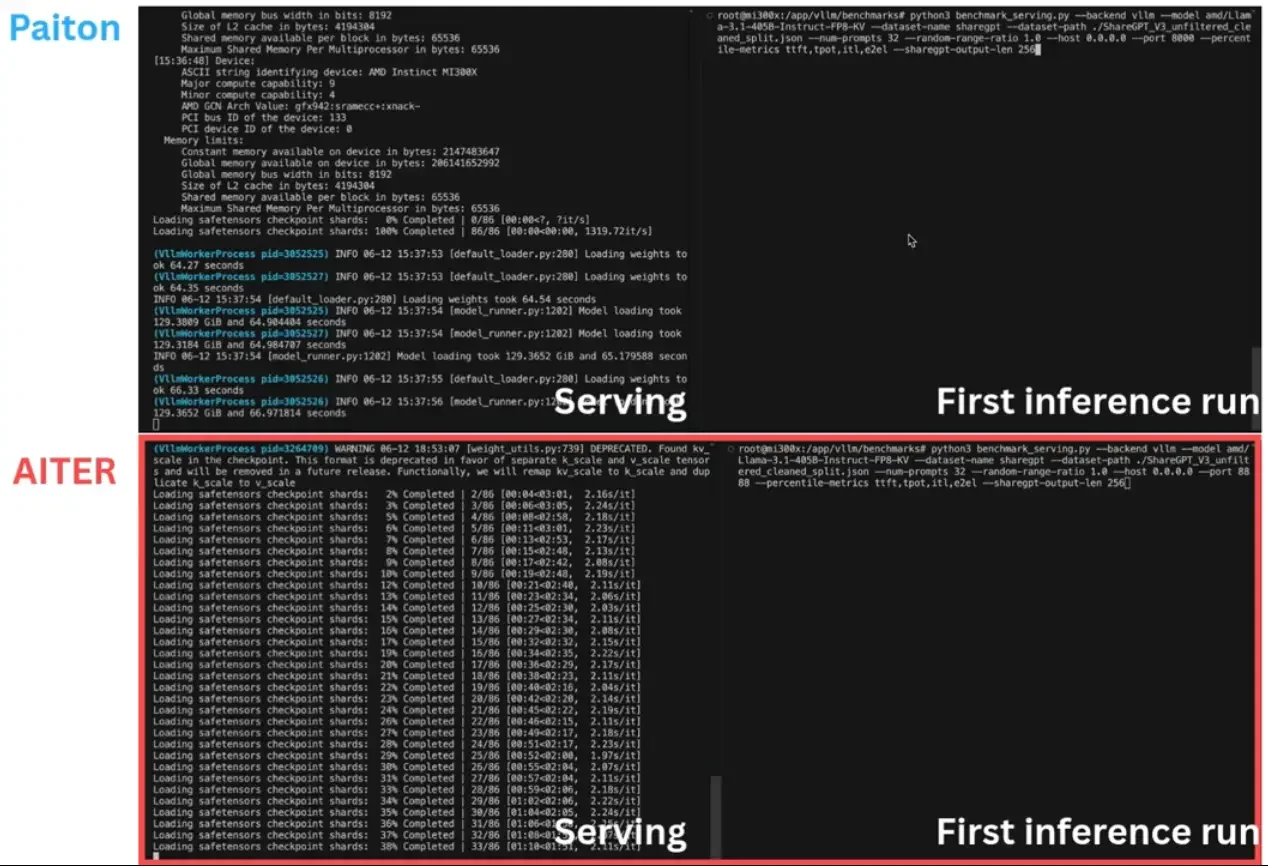
AI Model Benchmarking
- Compare model inference speeds using vLLM across different hardware configurations.
Software Performance Testing
- Measure system performance across hardware configurations and different optimization settings.
Continuous Integration (CI) Benchmarking
- Integrate into CI/CD pipelines to fail builds if performance regresses.
8. Conclusion
Benchmarking doesn’t have to be complex. Our new tool, powered by dstack, brings automation, reproducibility, and scalability to the benchmarking process. By leveraging vLLM, we ensure that our benchmarks maintain consistency, reliability, and broad applicability across different hardware configurations.
Yes, this was just a Blog where we boast about our great benchmarking tool. But we’re thinking about open-sourcing it, let us know if you’re interested!