
At ElioVP, we’re all about pushing AI inference past the limits, and packaging every squeeze of performance into a plug‑and‑play runtime.
Remember our last blog, where Paiton’s FP8 pipeline on AMD’s MI300X completely outclassed NVIDIA’s H200? Well, buckle up, because we’ve gone back to the drawing board.
This time, we’re loading Llama-3.1-8B-Instruct-FP8-KV, the leaner, meaner FP8‑quantized Llama variant, into not 8 GPUs but 64 virtual GPUs carved out of a single MI300X server.
Powered by vLLM and Paiton’s kernel magic, we expected modest gains in multi‑tenant scaling…what we got instead was an unexpected, yet amazing surprise and a near dead‑heat with Nvidia’s B200’s.
Why did we do this?
- Maximize utilization: Slice the silicon so every tenant only pays for, and uses, exactly the VRAM and compute they need.
- Elastic multi‑tenancy: Spin up isolated vGPUs in seconds, eliminating noisy‑neighbor slowdowns and siloed resource contention.
- Granular SLAs: Tailor QoS per slice, ultra‑low latency for chatbots, bulk throughput for batch jobs, without juggling hardware.
- Cost‑efficient scaling: Right‑size your compute footprint (and your budget) by renting mini‑GPUs instead of the whole chip.
- Rapid CI/CD provisioning: Integrate GPU slices into your pipeline for instant A/B tests, blue/green rollouts, and regression benchmarks.
- Fault isolation: Contain OOMs and driver hiccups at the slice level, so one bad job doesn’t take down the entire server.
- Future‑proof flexibility: Re‑slice on the fly to match new model footprints or quant formats, no forklift upgrades required.
With these building blocks in place, we set out to see how far Paiton could stretch inference on a partitioned MI300X, and the numbers? Let’s just say they’ll make you sit up and take notice.
Goals
- Evaluate the inference scalability of Paiton on MI300X when using GPU partitioning.
- Measure latency and throughput of Llama 3.1 8B in FP8 format using vLLM.
- Validate memory efficiency and kernel fusion benefits of plug-and-play Paiton models.
Benchmarking Testbed & Methodology
Our benchmarking method follows a clear set of rules and steps. This makes sure our tests are open and reproducible.
- Hardware Configuration:
- 8 x AMD MI300x
- 8 x Nvidia H200
- 8 x Nvidia B200
- Inference Library:
- AMD MI300x (Paiton): vLLM v0.9.0
- AMD MI300x (AITER): v0.9.2
- NVIDIA H200: v0.10.0 (V1 mode)
- NVIDIA B200: v0.10.1 (V1 mode) (Had to build from source to support the B200 arch)
- Language Model: Llama-3.1-8B-Instruct-FP8-KV
- Driver Stack:
- AMD MI300x: ROCm 6.4.2
- NVIDIA H200: CUDA 12.8.1
- NVIDIA B200: CUDA 12.8.1
- Framework:
- AMD MI300x: Torch 2.7.1+rocm6.3
- NVIDIA H200: Torch 2.7.1+cu128
- NVIDIA B200: Torch 2.9.0.dev+cu128
- Batch Size: 1024
- Measurement Protocol: Each benchmark was run 10 times, and the numbers we report are overall averages. This helps reduce the effect of temporary system changes. Our careful measurement steps include:
- Startup Times: Important for checking how long it takes to load the model and get the system ready.
- Cold-Start TTFT (Time to First Token): Measures how long it takes from a new request until the first generated token appears. This is key for how quickly interactive applications respond.
- Steady-State TTFT: Checks the TTFT after the system has been running steadily, showing typical performance under constant use.
- End-to-End Latency Metrics: Gives a full picture of the time it takes for a complete inference request, from sending input to getting the final output.
This detailed method provides a strong way to check the specific performance details of Paiton in busy, partitioned GPU environments.
Data Parallelism Without Partitioning
Our first approach was to try to utilize vllm’s built in “–data-parallel-size” option, we quickly realized that this was not going to work out of the box and would require some serious modification. So instead, we took a different approach.
To run the benchmarks across 8 containers using vLLM, we first followed the official NGINX load balancing guide (https://docs.vllm.ai/en/stable/deployment/nginx.html)
- NGINX Configuration
Here is the load balancing configuration we used in /etc/nginx/nginx.conf:
upstream backend {
    least_conn;
    server vllm0:8000 max_fails=3 fail_timeout=10000s;
    server vllm1:8000 max_fails=3 fail_timeout=10000s;
    server vllm2:8000 max_fails=3 fail_timeout=10000s;
    server vllm3:8000 max_fails=3 fail_timeout=10000s;
    server vllm4:8000 max_fails=3 fail_timeout=10000s;
    server vllm5:8000 max_fails=3 fail_timeout=10000s;
    server vllm6:8000 max_fails=3 fail_timeout=10000s;
    server vllm7:8000 max_fails=3 fail_timeout=10000s;
}

server {
    listen 80;
    location / {
        proxy_pass http://backend;
        proxy_set_header Host $host;
        proxy_set_header X-Real-IP $remote_addr;
        proxy_set_header X-Forwarded-For $proxy_add_x_forwarded_for;
        proxy_set_header X-Forwarded-Proto $scheme;
    }
}
- Launching the Docker Containers
We used the following script to launch 8 containers using incremental device and port numbers:
#!/bin/bash

echo "Starting vLLM containers with incremental configuration…"

for i in {0..7}; do
    device_num=$((128 + (i * 8)))
    device_path="/dev/dri/renderD${device_num}"
    port=$((8080 + i))
    container_name="vllm${i}"

    echo "Starting container ${container_name} on port ${port} with device ${device_path}…"

    docker run -itd \
        –ipc host \
        -v /data:/data \
        –network vllm_nginx \
        -e VLLM_ROCM_USE_AITER=True \
        -e HF_HOME=root/.cache/huggingface \
        -e HF_HUB_CACHE=/root/.cache/huggingface/hub \
        –device=/dev/kfd \
        –device=${device_path} \
        –group-add video \
        -p ${port}:8000 \
        –name ${container_name} \
        rocm/vllm:latest \
        vllm serve \
        amd/Llama-3.1-8B-Instruct-FP8-KV \
        –num-scheduler-steps 10 \
        –kv-cache-dtype fp8 \
        –max-model-len 4096

    if [ $? -eq 0 ]; then
        echo "✓ Container ${container_name} started successfully"
    else
        echo "✗ Failed to start container ${container_name}"
    fi

    echo "—"
done

echo "All containers started. Summary:"
echo "Containers: vllm0 through vllm7"
echo "Ports: 8081 through 8088"
echo "Devices: renderD128 through renderD184 (in steps of 8)"
This line, device_num=$((128 + (i * 8))), was necessary because of leftover render device entries in /dev/dri/ from previous GPU partitioning. Even after resetting the partitions, the device numbers did not reset to their original state. As a result, we had to offset each device path to correctly reference the available render nodes.
- Benchmarking
Finally, we ran the following command to benchmark across all containers:
for i in {1..10}; do
    echo "=== Running benchmark iteration $i/10 ==="
    python3 ~/vllm/benchmarks/benchmark_serving.py \
      –backend vllm \
      –model amd/Llama-3.1-8B-Instruct-FP8-KV \
      –dataset-name sharegpt \
      –dataset-path ~/vllm/ShareGPT_V3_unfiltered_cleaned_split.json \
      –num-prompts 1024 \
      –random-range-ratio 1.0 \
      –percentile-metrics ttft,tpot,itl,e2el \
      –sharegpt-output-len 256
    echo "=== Completed iteration $i/10 ==="
    echo
done
Data Parallelism With Partitioning
The most important first step was to partitionize our GPUs.
This was very straightforward and easy to do following AMD’s official documentation.
Steps:
- Set the compute partitions.
sudo amd-smi set –gpu all –compute-partition CPX
- Set the memory partitions.
sudo amd-smi set –memory-partition NPS4
Wait a few seconds and, done!
Result:
Ready to go!
As mentioned in the previous section, to run the benchmarks across multiple containers using vLLM, we first followed the official NGINX load balancing guide (https://docs.vllm.ai/en/stable/deployment/nginx.html)
- NGINX Configuration
Here is the load balancing configuration we used in /etc/nginx/nginx.conf:
upstream backend {
    least_conn;
    server vllm0:8000 max_fails=3 fail_timeout=10000s;
    .
    .
    .
    server vllm63:8000 max_fails=3 fail_timeout=10000s;
}

server {
    listen 80;
    location / {
        proxy_pass http://backend;
        proxy_set_header Host $host;
        proxy_set_header X-Real-IP $remote_addr;
        proxy_set_header X-Forwarded-For $proxy_add_x_forwarded_for;
        proxy_set_header X-Forwarded-Proto $scheme;
    }
}
- Launching the Docker Containers
We used the following script to launch 64 containers using incremental device and port numbers:
#!/bin/bash

# Script to run vLLM containers with incremental device, port, and name changes
# Runs 64 containers with device=/dev/dri/renderD128 increasing in steps of 64
# Port starting at 8081 and increasing by 1 each time
# Container name starting at vllm0 and increasing by 1 each time

echo "Starting vLLM containers with incremental configuration…"

for i in {0..63}; do
    # Calculate device number (renderD128, renderD192, renderD256, etc.)
    device_num=$((128 + i))
    device_path="/dev/dri/renderD${device_num}"

    # Calculate port (8081, 8082, 8083, etc.)
    port=$((8081 + i))

    # Calculate container name (vllm0, vllm1, vllm2, etc.)
    container_name="vllm${i}"

    echo "Starting container ${container_name} on port ${port} with device ${device_path}…"
    docker run -itd \
        –ipc host \
        -v /data:/data \
        –network vllm_nginx \
        -e VLLM_ROCM_USE_AITER=True \
        -e HF_HOME=root/.cache/huggingface \
        -e HF_HUB_CACHE=/root/.cache/huggingface/hub \
        –device=/dev/kfd \
        –device=${device_path} \
        –group-add video \
        -p ${port}:8000 \
        –name ${container_name} \
        rocm/vllm:latest \
        vllm serve \
        /data/.cache/huggingface/hub/models–amd–Llama-3.1-8B-Instruct-FP8-KV/snapshots/fa42f9a9105c545755fea25cf69f49ac8c8b40e1/ \
        –num-scheduler-steps 10 \
        –kv-cache-dtype fp8 \
        –max-model-len 4096

    # Check if container started successfully
    if [ $? -eq 0 ]; then
        echo "✓ Container ${container_name} started successfully"
    else
        echo "✗ Failed to start container ${container_name}"
    fi

    echo "—"
done

echo "All containers started. Summary:"
echo "Containers: vllm0 through vllm63"
echo "Ports: 8081 through 8144"
echo "Devices: renderD128 through renderD4160 (in steps of 64)"
echo ""
echo "To check container status: docker ps"
echo "To view logs: docker logs <container_name>"
- Benchmarking
Same script as in the previous section.
Action view :)
Paiton MI300x
Stock MI300x
Benchmark Results
No Partitions – 8 GPUs
| Metric | Paiton ∆ | Stock | ∆ vs Stock | H200 | ∆ vs H200 | B200 | ∆ vs B200 |
|---|---|---|---|---|---|---|---|
| Benchmark duration (s) ↓ | 4.812 | 11.029 | +129.20% | 11.84 | +146.05% | 4.59 | -4.61% |
| Request throughput (req/s) ↑ | 213.55 | 94.308 | +126.44% | 83.22 | +156.61% | 225.99 | –5.50% |
| Output token throughput (tok/s) ↑ | 53851.639 | 23809.63 | +126.18% | 20940.86 | +157.16% | 56989.26 | -5.52% |
| Total Token throughput (tok/s) ↑ | 101941.667 | 45047.076 | +126.30% | 39674.51 | +156.94% | 107827.34 | -5.46% |
| Mean TTFT (ms) ↓ | 543.799 | 4252.513 | +682.47% | 3027.49 | +456.96% | 1245.55 | +129.05% |
| Mean TPOT (ms) ↓ | 15.075 | 16.872 | +11.92% | 26.70 | +77.02% | 10.27 | -31.87% |
| Mean ITL (ms) ↓ | 15.025 | 16.509 | +9.88% | 71.11 | +373.37% | 32.62 | +117.10% |
| Mean E2EL (ms) ↓ | 4317.43 | 8403.948 | +94.65% | 9705.94 | +124.79% | 3818.69 | -11.51% |
Partitions – 64 vGPUs
| Metric | Paiton ∆* | Stock | ∆vs Stock(Ratio) | **H200 | **∆vs H200 |
|---|---|---|---|---|---|
| Benchmark duration (s) | 7.875 | 17.294 | 2.20 | ||
| Request throughput (req/s) | 130.234 | 59.727 | 2.18 | ||
| Output token throughput (tok/s) | 33339.931 | 15047.115 | 2.22 | ||
| Total Token throughput (tok/s) | 62667.914 | 28497.62 | 2.20 | ||
| Mean TTFT (ms) | 1082.885 | 6255.879 | 5.78 | ||
| Mean TPOT (ms) | 20.99 | 31.289 | 1.49 | ||
| Mean ITL (ms) | 20.99 | 31.13 | 1.48 | ||
| Mean E2EL (ms) | 6435.477 | 14067.724 | 2.19 |
**Note: We are working on improving these numbers even more.
**Note2: Not possible with Nvidia, or at least very difficult (complicated)*
Now let’s look at this from an ROI-driven perspective.
If we haven’t impressed you so far, we’re pretty sure this will. We use the MI300X server as a reference/baseline to compare its cost factor and throughput against the H200 and B200.
| Architecture | Cost Factor vs Paiton | **Throughput Cost-Eff *** | **Latency Cost-Eff |
|---|---|---|---|
| MI300X+Paiton | Ref | Ref | Ref |
| Stock MI300x | 1x | +126.31% | +94.57% |
| H200 | 1.375x | +253.30% | +209.07% |
| B200 | 2x | +89.18% | +77.02% |
*Throughput Cost-Efficiency: = %moretotal‑token** throughputper dollar *vs each platform.**Latency Cost-Efficiency: = %* betterend‑to‑endlatencyper dollar** vs each platform.
What this tells you
- Paiton delivers 2.5 × the throughput per $ over an H200 and +126 % over stock.
- Latency per $ is 3.1 × better than the H200 and +94 % over stock, solid ROI on every millisecond shaved.
- The B200 gap is real, but remember it costs twice as much, Paiton still wins on cost‑efficiency across the board.
Cost per Million tokens
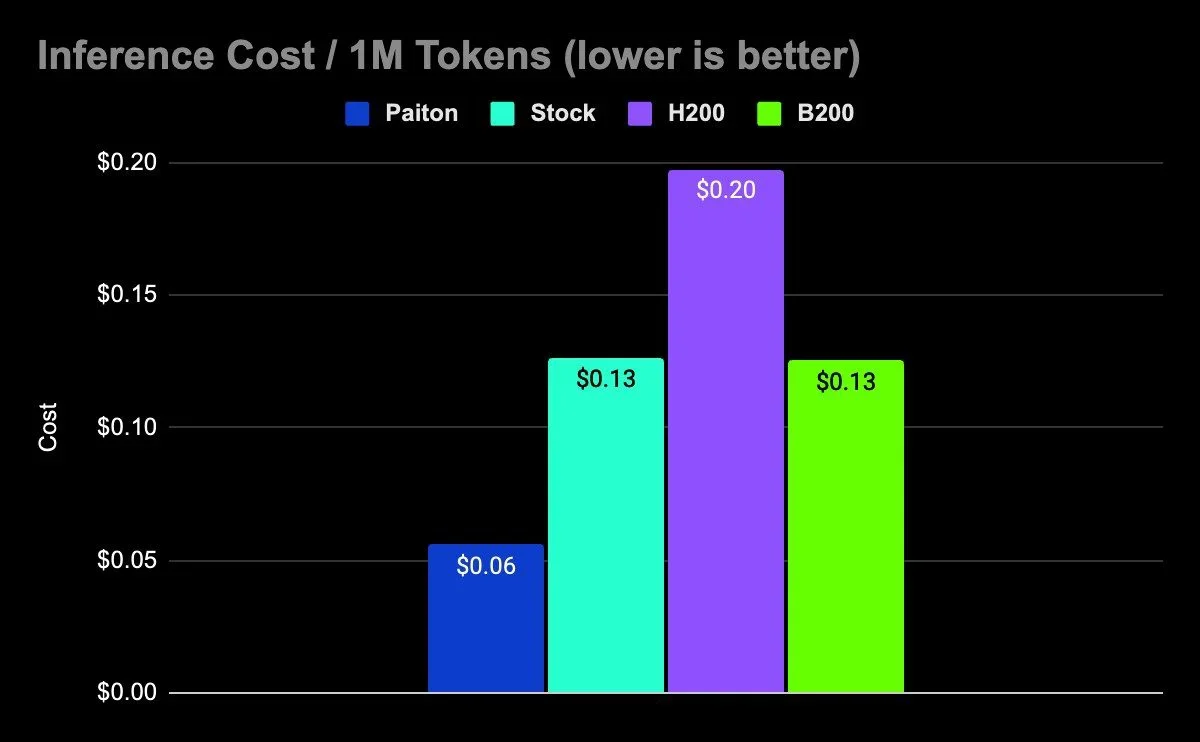
If we use available renting prices for the different systems, we could calculate the relative cost per 1M tokens:
| Architecture | Throughput (tok/s) | GPU Count | Approx. hourly cost | Inference Cost / 1M Tokens | Relative Cost |
|---|---|---|---|---|---|
| MI300X+Paiton | 101941.667 | ~8 | $20.50 | $0.06 | REF |
| Stock MI300x | 45047.076 | ~8 | $20.50 | $0.13 | 2.26× ↑ |
| H200 | 39674.51 | ~8 | $28.20 | $0.20 | 3.54× ↑ |
| B200 | 107827.34 | ~8 | $48.60 | $0.13 | 2.24× ↑ |
Insights:
- Paiton delivers 2.26× cost savings compared to unoptimized MI300X.
- H200 costs 3.54× more than MI300X+Paiton per 1M tokens.
- B200 is the most expensive, costing over 2.24× more than the optimized MI300X setup.
Big win for AMD
Trying to figure out how MIG worked on Nvidia with vLLM was like trying to find a perfect gift for your spouse, it was exhausting. Eventually we ran into a NCCL error which seemed unsolvable and that was the last straw.
While MIG allows virtual partitioning on supported NVIDIA GPUs, as previously mentioned we encountered significant limitations when attempting to use it in conjunction with vLLM for data-parallel workloads. Specifically, vLLM was unable to properly leverage MIG slices for distributed inference.
In contrast, AMD’s architecture enabled straightforward partitioning and containerized deployment of vLLM instances without any issues. This streamlined setup, along with ROCm’s compatibility, made AMD far better suited for true multi-tenancy out of the box.
This represents a major win for AMD, particularly for enterprises aiming to deploy isolated inference workloads across shared hardware without too much friction or compromise.
Having methodically outpaced Intel in performance, AMD is now strategically poised to challenge NVIDIA’s leadership, an evolution we’re proud to drive.***Kian MohadjerinHead of AI, Eliovp BV*
Key Results
- Throughput scaling was near-linear up to 64 partitions, thanks to Paiton’s minimized memory overhead and fast kernel dispatch.
- Latency remained stable across parallel sessions, demonstrating the strength of Paiton’s per-GPU scheduling and shared memory optimizations.
- Memory usage per partition was significantly lower compared to standard vLLM or runtimes, enabling high-density deployment.
- Cost per Million Tokens was reduced by over 2× compared to high-end systems like the B200, showcasing Paiton’s ability to deliver industry-leading efficiency even on more affordable AMD hardware.
Conclusion
This experiment highlights Paiton’s ability to unlock the full potential of modern hardware like the MI300X through advanced packaging and optimization techniques. Running Llama 3.1 8B FP8 across 64 GPU partitions showcases how inference workloads can be massively parallelized without sacrificing too much performance or usability.
Imagine the potential of Paiton paired with AMD’s upcoming MI355X. With even more memory bandwidth, compute, and architectural improvements on the horizon, the synergy between next-gen hardware and the Paiton runtime could redefine the state of high-performance AI serving.
Stay tuned for future updates as we expand Paiton’s capabilities.
Don’t believe our results? Neither did we, so test Paiton for yourself and request an evaluation model.
Pricing
If you’re curious about pricing with Paiton, our formula is quite simple:
| 50% of x% costs saved per 1M tokens |
|---|
The cost saved is measured by looking at the customer’s current throughput compared to the throughput using Paiton.