
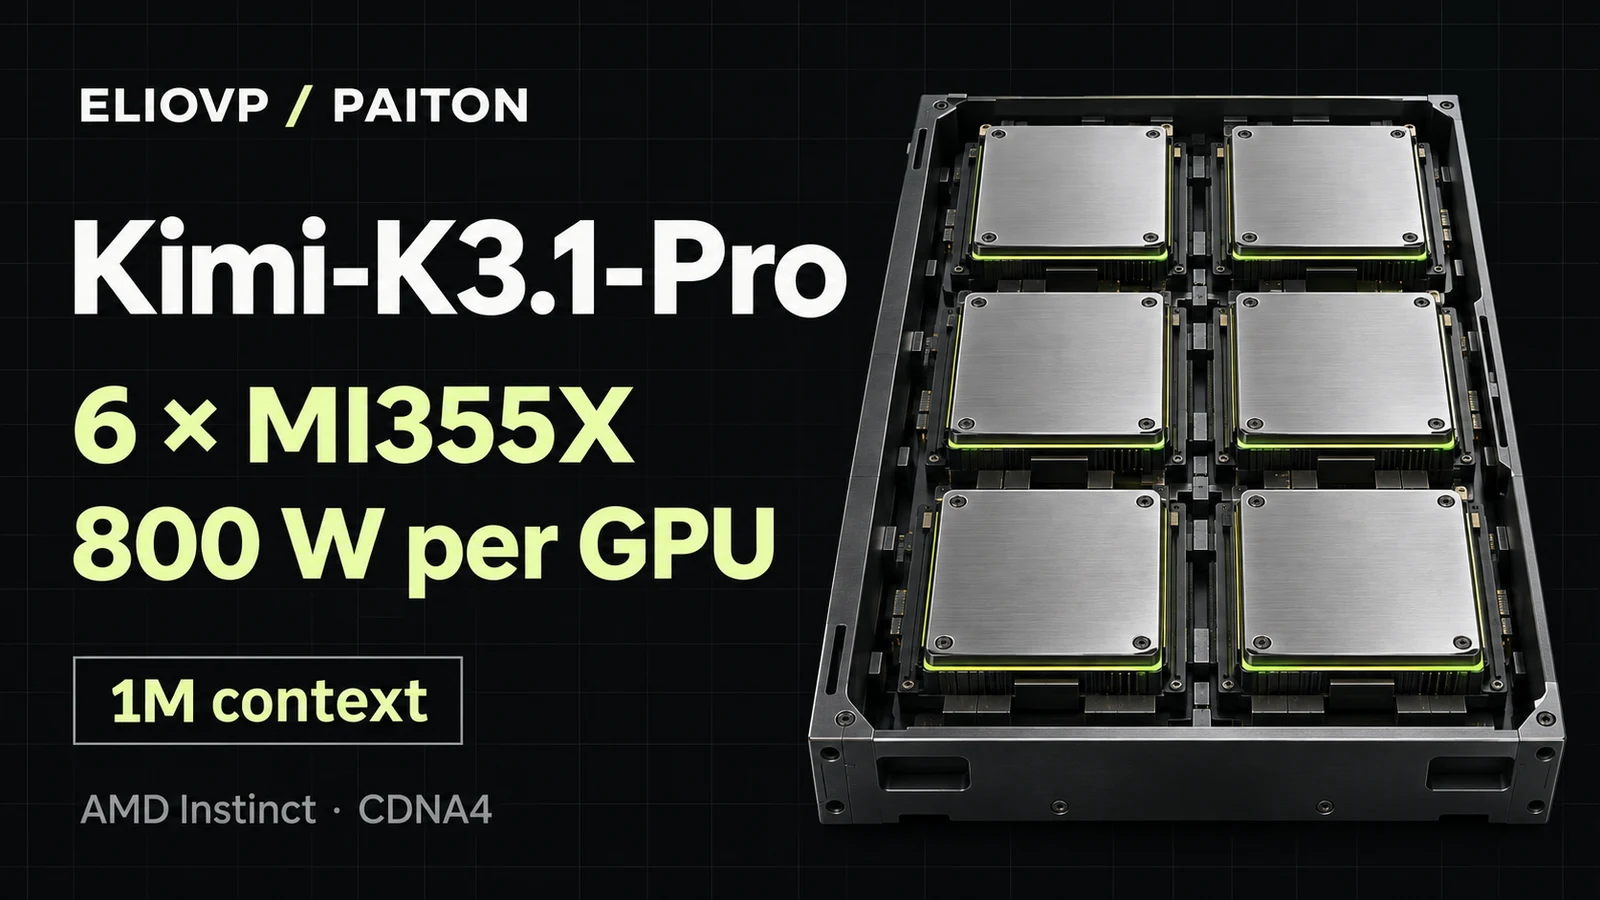
Kimi-K3.1-Pro has 2.8 trillion parameters. With Paiton, our AI optimization framework, it runs on six AMD Instinct MI355X GPUs capped at 800 W each. Two GPUs in the eight-GPU node stay unused by the model.
On 8K-input/1K-output requests at sampling temperature 0 and 800 W per GPU, we measured 5,661 total tokens/s, or 944 per GPU. AMD publishes 936 per GPU for ATOM on eight MI355X GPUs. Paiton's six GPUs drew an average of 4.18 kW during that workload. A separate test also fit a million-token prompt on the same six GPUs at the same power cap.
There are limits to the comparison. AMD does not state the power limits or sampling temperatures for its throughput tables. Its eight-GPU nodes have higher total throughput, and vLLM remains ahead per GPU on the 128K-input workload. Throughout this article, total tokens means input plus output, not generated tokens alone.
Update, 12 November 2026: We fixed a bug in how Paiton read one attention parameter. It hurt recall past about 100K tokens and could cause repetition in long agent sessions. After the fix, the model recalled 72 of 72 planted codes in tests at 31K, 120K and 228K tokens; before, it recalled 31 of 48 in the 120K and 228K tests. Speed at 800 W is unchanged. Our exact reference and the free community build had the same bug. The accuracy section now uses the corrected reference. The community fix is in the plugin repo; its container image is being rebuilt.
The header is an illustration. The terminal captures and benchmark recordings below are supplied run evidence.
In this article
- The setup and recorded run
- Throughput and latency
- GPU power and cost scenarios
- Why six GPUs and 800 W
- Sampling and accuracy
- Running on four GPUs
- Try the community build
- Measurement details and a second benchmark
The setup and recorded run
The original Paiton speed and power measurements below were recorded on 10-11 November 2026. AMD's 4 November article reports ATOM and vLLM results; vLLM's own article reports the vLLM figures. These are separate runs on different nodes, not a controlled software comparison on one machine.
| Setting | Paiton | ATOM, published by AMD | vLLM, published by AMD |
|---|---|---|---|
| GPUs | 6 × MI355X | 8 × MI355X | 8 × MI355X |
| Power limit per GPU | 800 W | Not stated | Not stated |
| Combined GPU power limit | 4.8 kW | Not stated | Not stated |
| Measured GPU draw, 8K/1K, T=0 | 4.18 kW, about 696 W/GPU | Not published | Not published |
| Sampling temperature | 0 and 1.0, reported separately | Not stated | Not stated |
| Speculative decoding | DSpark, Inferact drafter | DSpark, five drafts | Throughput-table setting not stated |
Original mid-run capture, temperature 0. The instantaneous readings near 800 W differ from the run's average draw of about 696 W per active GPU.
Benchmark recording at 4× speed, not real time. Six MI355X GPUs, 800 W cap per GPU, sampling temperature 0.
Open the six-GPU recording or inspect the original result screen.
Throughput and latency
We used the stock vllm bench serve client with random prompts, 64 requests and at most 16 requests in flight, matching AMD's published workload shape. Prefix caching was off and EOS was ignored. The throughput runs used a maximum sequence length of 140,000 tokens; the million-token test used a separate configuration.
8K input and 1K output
| Runtime and GPU power cap | Sampling temperature | Total tok/s, node | Total tok/s/GPU | Output tok/s, node | Median TTFT | Median TPOT |
|---|---|---|---|---|---|---|
| Paiton, 6 GPUs × 800 W | 0 | 5,661 | 944 | 629 | 0.65 s | 20.4 ms |
| Paiton, 6 GPUs × 800 W | 1.0 | 4,535 | 756 | 504 | 1.23 s | 30.6 ms |
| ATOM, 8 GPUs, cap unstated | Unstated | 7,484 | 936 | 831.6 | 0.821 s | 16.36 ms |
| vLLM, 8 GPUs, cap unstated | Unstated | 6,015 | 752 | 668.4 | 1.875 s | 22.06 ms |
TTFT: time to first token. TPOT: time per output token after the first. Paiton T=0 at 800 W per GPU is the mean of two runs, 5,673 and 5,648 total tok/s; T=1.0 is one run. Per-GPU figures are rounded. AMD uses TP8/DCP8, concurrency 16 and 64 prompts.
At T=0, Paiton's per-GPU throughput is close to ATOM's published result. At T=1.0, it is close to vLLM's. These pairings are illustrative: AMD's unreported sampling temperatures prevent a temperature-matched comparison. In those pairings, Paiton's output-token latency is higher and its first-token latency lower.
128K input and 100 output
| Runtime and GPU power cap | Sampling temperature | Total tok/s, node | Total tok/s/GPU | Median TTFT |
|---|---|---|---|---|
| Paiton, 6 GPUs × 800 W | 0 | 12,768 | 2,128 | 122 s |
| Paiton, 6 GPUs × 800 W | 1.0 | 12,885 | 2,148 | 100 s |
| ATOM, 8 GPUs, cap unstated | Unstated | 14,005 | 1,751 | 27.9 s |
| vLLM, 8 GPUs, cap unstated | Unstated | 17,678 | 2,210 | 105.5 s |
Paiton: six MI355X GPUs at 800 W each. Published AMD results: eight MI355X GPUs, power limits and sampling temperatures unstated. The tables above contain the chart values. Download the SVG.
Paiton at T=0 and 800 W per GPU is about 22% ahead of ATOM per GPU on 128K/100, and about 4% behind vLLM. ATOM has much lower first-token latency. In Paiton's run, 16 long requests arrive together and their prompts are processed sequentially, so requests wait behind earlier prefills. A good tokens-per-GPU figure does not remove that wait.
One request and a million-token prompt
| Paiton, 6 MI355X GPUs × 800 W | Sampling temperature | Median TPOT | Approximate output tok/s | Median TTFT |
|---|---|---|---|---|
| 8K/1K, one request at a time | 0 | 4.35 ms | 230 | 0.61 s |
| 8K/1K, one request at a time | 1.0 | 11.5 ms | 87 | 0.61 s |
Eight random-prompt requests per configuration. Output speed is the reciprocal of median TPOT.
Random prompts favor speculative decoding at T=0 because their greedy continuations become repetitive. On real text at 800 W per GPU, the same path produced about 100 output tokens/s for one request. AMD's single-request figures use synthetic draft acceptance, so we have not put them in this table.
In the separate long-context test on six GPUs at 800 W each, one request with 1,040,000 input tokens and 64 output tokens took 90 seconds to its first token, then 19.9 ms per output token. The maximum sequence length and KV pool were both 1,052,672 tokens. GPU memory use reached roughly 98%. This demonstrates that the context fits on six GPUs at 800 W each; it is not the configuration used for the throughput tables.
GPU power and cost scenarios
Our six GPUs averaged 4.18 kW on 8K/1K and 4.58 kW on 128K/100 at T=0, below their combined 4.8 kW cap. These readings cover GPUs only, not the host or cooling.
AMD does not publish measured draw or configured caps for its runs. For the calculations below, we assume 1,400 W per GPU, or 11.2 kW for eight GPUs, using the MI355X's rated typical board power. That specification is not evidence that AMD ran at that cap or consumed that power.
| Total tok/s per kW | 8K/1K | 128K/100 |
|---|---|---|
| Paiton T=0, 6 GPUs × 800 W, actual 4.8 kW GPU cap | 1,179 | 2,660 |
| Paiton T=0, 6 GPUs × 800 W, measured 4.18/4.58 kW GPU draw | 1,354 | 2,788 |
| ATOM, assumed 11.2 kW GPU cap | 668 | 1,250 |
| vLLM, assumed 11.2 kW GPU cap | 537 | 1,578 |
Input plus output tokens. Paiton T=0, six GPUs × 800 W; AMD sampling temperatures and actual caps are unstated. Dividing by assumed caps does not measure comparative energy efficiency. Download the SVG.
GPU electricity
At an assumed $0.10/kWh, these are GPU-only costs per million total tokens. CPUs, networking and cooling are excluded.
| Electricity scenario | 8K/1K | 128K/100 |
|---|---|---|
| Paiton T=0, 6 GPUs at their 4.8 kW cap | $0.024 | $0.010 |
| Paiton T=0, measured GPU draw | $0.021 | $0.010 |
| ATOM, 8 GPUs assumed at 11.2 kW | $0.042 | $0.022 |
| vLLM, 8 GPUs assumed at 11.2 kW | $0.052 | $0.018 |
The calculation is kW × price per kWh × 1,000,000 ÷ (tokens/s × 3,600). At continuous GPU draw of 4.8 or 11.2 kW, annual electricity would be $4,205 or $9,811. These scenarios cannot establish a measured electricity saving against AMD.
GPU rental
For an illustrative GPU-cost allocation, we use published rates checked on 11 November 2026: TensorWave starts at $2.95/GPU-hour, Daytona lists $5.99/GPU-hour with CPU, RAM and storage priced separately, and Oracle lists $8.60/GPU-hour for bare-metal service. These different offers are not interchangeable whole-node quotes. All rows use total tokens, including prompt tokens.
| Cost per million total tokens | At $2.95/GPU-h | At $5.99/GPU-h | At $8.60/GPU-h |
|---|---|---|---|
| 8K/1K, Paiton, 6 GPUs × 800 W, T=0 | $0.87 | $1.76 | $2.53 |
| 8K/1K, Paiton, 6 GPUs × 800 W, T=1.0 | $1.08 | $2.20 | $3.16 |
| 8K/1K, ATOM, 8 GPUs, cap/T unstated | $0.88 | $1.78 | $2.55 |
| 8K/1K, vLLM, 8 GPUs, cap/T unstated | $1.09 | $2.21 | $3.18 |
| 128K/100, Paiton, 6 GPUs × 800 W, T=0 | $0.39 | $0.78 | $1.12 |
| 128K/100, ATOM, 8 GPUs, cap/T unstated | $0.47 | $0.95 | $1.36 |
| 128K/100, vLLM, 8 GPUs, cap/T unstated | $0.37 | $0.75 | $1.08 |
Rental cost is GPU count × hourly rate × 1,000,000 ÷ (tokens/s × 3,600). If you rent an indivisible eight-GPU node, leaving two GPUs unused will not reduce the invoice. They are capacity for another workload, subject to the host's remaining resources. Test combined workloads before counting that capacity as revenue.
Why six GPUs and 800 W
The model's roughly 1.56 TB of weights and a million-token KV pool fit on six MI355X GPUs. Paiton's own sharding supports that GPU count even though the model's main dimensions do not divide evenly by six. The framework runs its own HIP kernels on the GPUs.
Two GPUs and 576 GB of rated HBM capacity remain outside the Kimi process. Embeddings, reranking or a second model could use them, but those combinations were not benchmarked here. Six GPUs also have less compute and memory bandwidth than eight. The published eight-GPU results lead in total node throughput.
The 800 W limit came from our single-phase PDU. Testing at 1,000 W per GPU brought the feed close to its limit; sustained eight-GPU operation at 1,400 W was beyond that supply. All end-to-end Paiton benchmark results in this article use 800 W per GPU.
What 1,400 W might change
We could not run the full model at 1,400 W. The following ranges are projections from limited component tests, assuming faster prefill and at most 10% faster decode. They have not been validated at that power limit.
| Paiton on 6 GPUs, total tok/s/GPU | Measured at 800 W/GPU | Estimated at 1,400 W/GPU |
|---|---|---|
| 8K/1K, T=0 | 944 | 1,035-1,105 |
| 8K/1K, T=1.0 | 756 | 830-885 |
| 128K/100, T=0 | 2,128 | 2,780-2,790 |
The 1,400 W values are extrapolations from a component test and assumed decode scaling. They are not measured whole-model results or a performance promise. Download the SVG.
Sampling and accuracy
Paiton uses the public Inferact DSpark drafter. Sampling temperature changes how many drafted tokens the target model accepts. At T=0, repetitive random-prompt continuations are easier to predict; at T=1.0, more drafts are rejected. This is why we report both temperatures without assigning either one to AMD's unpublished settings.
The following results are from the fixed six-GPU build at 800 W per GPU, with a 1M-token context, greedy decoding and thinking off. We used the same harness and test sets as before; MMLU-Pro is new to this post.
| Benchmark | Fixed build, 12 November 2026 | Previously reported, affected build |
|---|---|---|
| GSM8K, five-shot | 197/200 (98.5%) | 185/200 (92.5%) |
| HumanEval, pinned OpenAI set | 159/164 (97.0%) | 160/164 (97.6%) |
| MMLU-Pro | 1,157/1,400 (82.6%) | Not previously reported |
HumanEval is unchanged within measurement noise. These checks do not establish accuracy on every task.
Our earlier KL figures used a flawed reference and are no longer valid. Against the corrected exact model, the served settings have a prefill-path KL divergence of 0.0078 across 47 held-out rows and 85,152 positions, with 96.4% top-1 agreement. Against that same corrected reference, the old build scores 0.109 and stock vLLM scores 0.0030. Lower KL means closer to the reference distribution, not necessarily better answers on every task.
We have not re-measured decode-path KL.
Running on four GPUs
The timings in this section were measured before the fix. The corrected six-GPU accuracy results above do not validate this four-GPU configuration.
Paiton also runs Kimi-K3.1-Pro on four MI355X GPUs at 800 W each. The weights do not fit entirely in their HBM, so the node's two AMD EPYC 9575F CPUs compute part of the expert workload.
| Paiton, 4 GPUs × 800 W plus CPU experts | Total tok/s, node | Total tok/s/GPU | Median TPOT, 16 concurrent | Single-request TPOT |
|---|---|---|---|---|
| 8K/1K, T=0 | 915 | 229 | 152 ms | 26.1 ms, about 38 output tok/s |
| 8K/1K, T=1.0 | 781 | 195 | 179 ms | 26.4 ms, about 38 output tok/s |
Same 64-request, concurrency-16 workload; T=0 is the mean of two runs. Single-request timing is a separate test. GPUs 2-5 are active.
Accelerated benchmark recording, not real time. Four MI355X GPUs at an 800 W cap each, with CPU experts, sampling temperature 0.
Open the four-GPU recording or inspect the original result screen.
This uses fewer GPUs but loses substantial throughput while waiting for CPU work. The four unused GPUs share that busy host. Two concurrent Kimi instances have not been validated.
Try the community build
The free community build and launcher run the model on four supported AMD Instinct CDNA4 GPUs. It is plain Python/PyTorch, with no Paiton kernels, batching or speculative decoding. It is a way to inspect the model and try your own prompts; it does not reproduce Paiton's performance.
| Four MI355X GPUs at 800 W each, T=0 | Community build | Paiton |
|---|---|---|
| One request, time per output token | 1.9-4.6 s | About 26 ms |
| Prefill | About 5 input tok/s | About 3,200 input tok/s |
| Concurrent requests | 1 | 16 |
| Complete 8K/1K request | About 1-2 hours, estimated | 29 s |
Historical measurements before the fix, at 800 W per GPU. Community prefill: 1,175 tokens in 239 seconds; Paiton prefill: roughly 8K tokens in 2.6 seconds. The community 8K/1K duration is estimated from measured phase speeds, not a completed two-hour benchmark. These phase tests differ in prompt length.
As of 12 November 2026, the community fix is in the plugin repo and the container image is being rebuilt. The tag below identifies the original release; it is not confirmation that a pull includes the fix.
ghcr.io/eliovp/paiton-vllm-plugin:kimi31pro-rocm10.1.0-pytorch2.13.0-cdna4-v1
Read the guide before downloading. It requires supported gfx950 GPUs, at least 768 GB of host RAM and storage for roughly 1.6 TB of weights plus the approximately 37 GB image. It serves one request at a time with a default maximum length of 32,768 tokens; this is not a validated million-token community setup. The code's Apache-2.0 license and Kimi's model terms are separate. Check the model's commercial conditions for your use.
Measurement details and a second benchmark
Our node has eight MI355X GPUs, two 64-core EPYC 9575F CPUs and 2.2 TB of RAM. Six-GPU tests used GPUs 2-7; four-GPU tests used GPUs 2-5. GPU power was sampled with amd-smi metric -p every two to three seconds, with configured limits saved alongside the results.
The serving client came from vllm/vllm-openai-rocm:kimi-k31. For 8K/1K it used --dataset-name random --random-input-len 8192 --random-output-len 1024 --num-prompts 64 --max-concurrency 16 --ignore-eos. T=0 requests explicitly set --temperature 0; the other run used Paiton's server default of 1.0. Prefix caching was disabled and prefill chunks were 8,192 tokens.
We also ran LocalMaxxing's open CLI, lmx 0.1.60, against Paiton on six MI355X GPUs capped at 800 W each with the million-token configuration. Its prompts and timing differ from the random-token benchmark.
| LocalMaxxing CLI test, 6 GPUs × 800 W | Recorded result |
|---|---|
| One request, canonical reasoning prompt | 183 output tok/s; 116 ms to first token |
| One cold request, prefill | 12,844 input tok/s at 8K; 13,370 at 128K, 9.5 s |
| Sustained decode, 16 requests, short prompts | 741 aggregate output tok/s; median 46 tok/s per request |
| Sustained decode, 16 requests, 64K prompts | 663 aggregate output tok/s; median 28 tok/s per request |
Aggregate output is counted across each 30-second decode cell. Per-request speed is the median reciprocal inter-token latency, not aggregate throughput divided by concurrency.
These are our local CLI results, not a published leaderboard entry. Submission was rejected because the accepted AMD Instinct list stopped at MI300X and MI325X and did not include MI355X. The saved results page and original screenshot are available here.
Thanks to Moonshot AI for the released weights, Inferact for the drafter, and the AMD ATOM and vLLM teams for publishing their measurements. Our earlier MI350P results and R9700 work cover other model and hardware budgets.
Running a token factory?
Or planning one? Bring your model, latency target and hardware budget. We can test the tradeoffs with you.